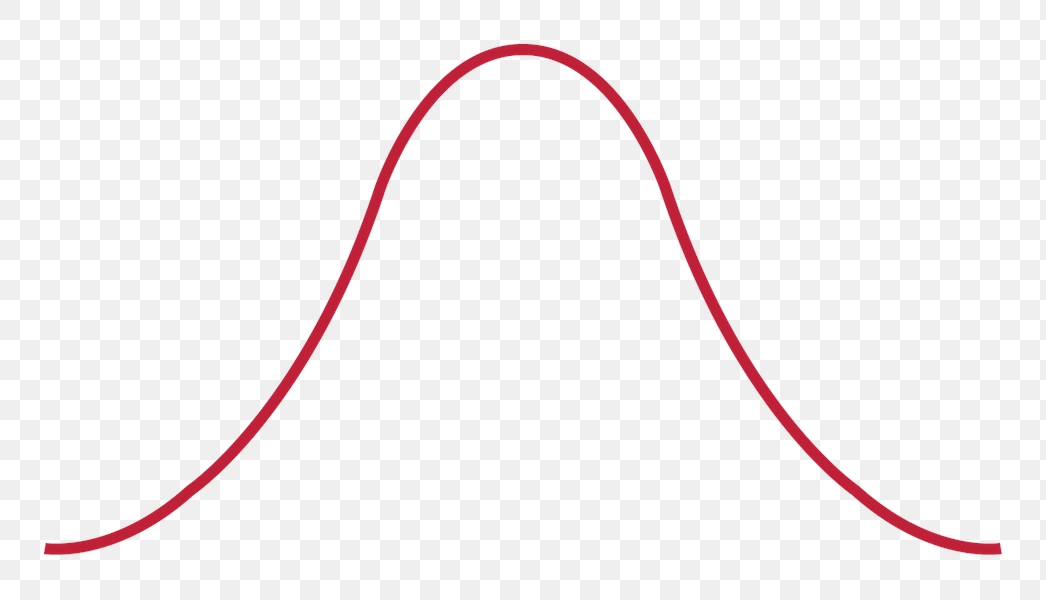
Red Bell Curve Graph Representation - PNG Image
The image depicts a bell curve, a fundamental concept in statistics that illustrates the normal distribution of data. The curve is elegantly shaped, creating a symmetrical and smooth arch that peaks at the center, emphasizing the average or mean value. This representation is crucial in various fields, including social sciences and natural sciences, highlighting how data points are distributed in relation to the mean.
The bell curve is displayed prominently in a striking red color, drawing attention to its significance in statistical analysis. Notably, the image features a transparent background, which allows for versatile use in different contexts, such as presentations or educational materials. This visual tool effectively communicates key concepts in data analysis and can enhance the understanding of variability and probability within a dataset.